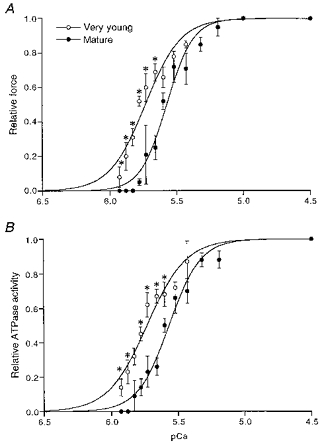
Figure 4. Isometric force and ATPase activity at different free Ca2+ concentrations.

Isometric force (A) and ATPase activity (B) for each trabecula are normalized to the control force and ATPase activity found at saturating Ca2+ concentration (pCa = 4.5). Mean values are shown ± s.e.m.*P < 0.05, significantly different from mature guinea-pigs. The Hill curves were fitted to the data points as indicated in the text.
