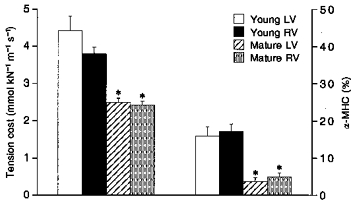
Figure 7. Differences in tension cost (left) and percentage of α-MHC (right) between young (1- to 8-week-old) and mature (9- to 26-week-old) guinea-pigs.

Mean values ± s.e.m.*P < 0.001, significantly different from young guinea-pigs (Student's t test). No significant differences were found between LV and RV.
