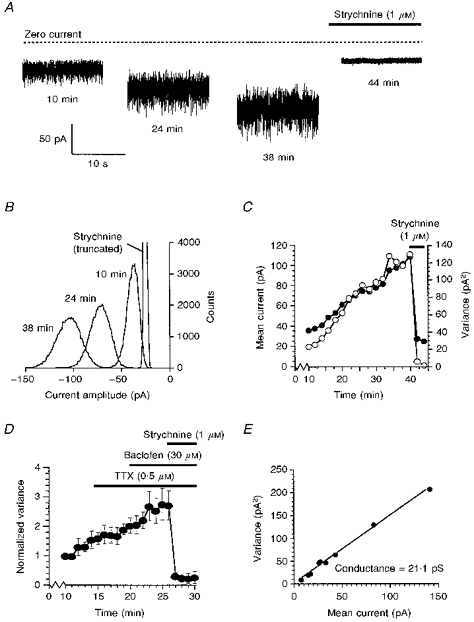
Figure 3. Glycine noise.

A, the increase in baseline noise which occurred during the recording was completely blocked by the glycine receptor antagonist strychnine. B, all-points histograms constructed from 5 s portions of the current traces shown in A. C, increase in mean current (•) and variance (○) over time. The mean current and variance were determined from the Gaussian distributions shown in B. In C and D, time is the time after initiation of whole-cell recording. D, TTX and the GABAB agonist baclofen had little or no effect on the glycine noise. The data points shown are the means of 3 cells. For each cell, the variance was normalized to the variance at 10 min. E, plot of variance against mean current amplitude from which the single-channel conductance underlying the glycine noise was estimated.
