
Figure 6. Comparison between young adult females (n = 29) and the mean range of values of young adult males in fourteen studies since 1960 which measured arterial blood gases at  .
.
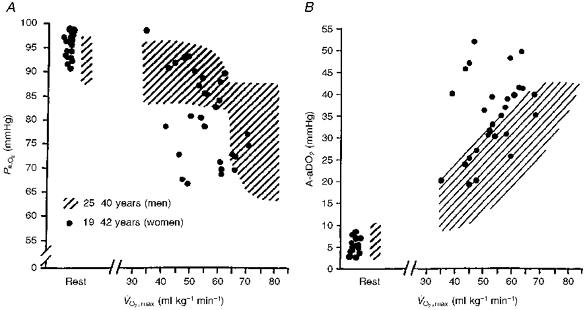
The hatched area represents male data (see summary in Dempsey et al. 1990), and filled circles are individual values for female subjects. A, Pa,O2vs. ; B, A-aDO2vs. .