
Figure 3. Ethanol effects on the function of 5-HT3 receptors.
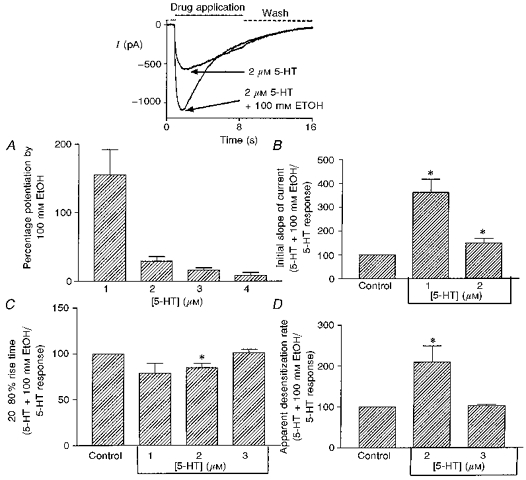
A, ethanol (100 mm) effect on the amplitude of the peak current induced by 1–4 μm 5-HT (n = 7–8 cells). The inset contains typical sweeps induced by 2 μm 5-HT ± 100 mm ethanol. B, ethanol (100 mm) effect on the initial slope of the current induced by 1 or 2 μm 5-HT (n = 11 cells). C, ethanol (100 mm) effect on the 20–80 % rise time of current induced by 1–3 μm 5-HT (n = 3, 8, and 8 cells for 1, 2, and 3 μm 5-HT, respectively). D, ethanol (100 mm) effect on the measured desensitization rate of the current induced by 2 and 3 μm 5-HT (n = 8 cells). All measurements in the presence of 100 mm EtOH were normalized to the same measurements on the same cell in the absence of EtOH. * Statistically significant difference relative to control at the 95 % confidence level; paired two-tailed Student's t test.