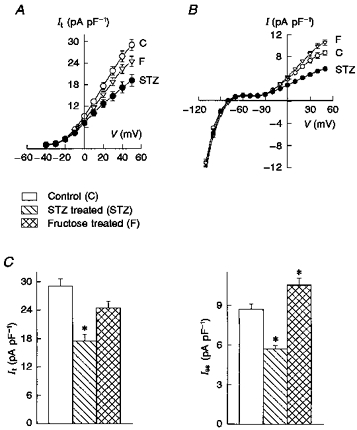
Figure 2. Current-voltage relationships for It (A) and for the steady-state current magnitudes (B), obtained by measurements at the end of 500 ms pulses.

Iss is represented by values between -30 and +50 mV, and IK1 by values between -40 and -110 mV. C, summary data showing the current densities (pA pF−1) at +50 mV, measured in myocytes from control rats (n = 34 myocytes), STZ-treated rats (n = 31) and fructose-fed rats (n = 30). It (left) decreased significantly only in the STZ model. Iss (right) decreased in the STZ model but increased in the fructose model. IK1 was not significantly altered, as can be seen in the current-voltage relationships in B. Values are means ± s.e.m.; *P < 0.05, compared with control.
