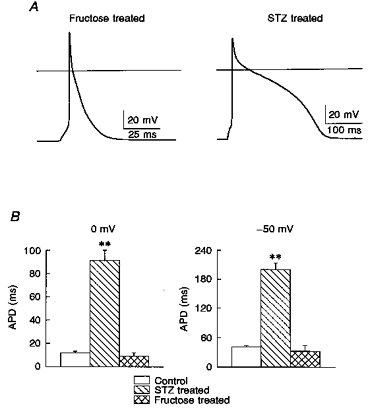
Figure 3. Action potentials in the two diabetic models.

A, action potentials obtained (at a stimulation rate of 0.5 Hz) in myocytes from a fructose-fed rat (left) and an STZ-treated rat (right). The continuous horizontal line indicates 0 mV. Note the marked prolongation in the myocyte from the STZ-treated (low-insulin) rat, in comparison to the absence of such an effect in the myocyte from the fructose-fed (high-insulin) rat. B, comparison of mean values ( ± s.e.m.) of action potential duration (APD), measured at 0 mV (left) and at -50 mV (right) in the 3 groups; control (n = 6 myocytes), STZ-treated (n = 10) and fructose-fed (n = 11) rats. APD was significantly increased (** P < 0.001) in the STZ model, compared with controls. APD was shorter (although failing to achieve significance) in the fructose model.
