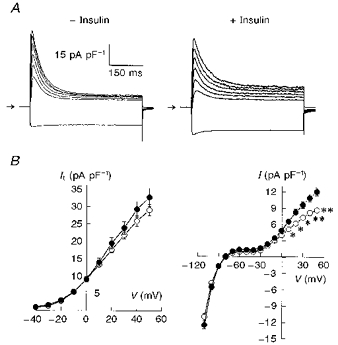
Figure 4. Effects of exposure to 100 nM insulin for 5–9 h on K+ currents in myocytes from control rats.

A, superimposed current traces obtained in response to different voltage steps (same as in Fig. 1) in myocytes in the absence (left) or presence (right) of insulin. Currents were divided by cell capacitance (50.0 and 67.6 pF, respectively), illustrating current densities for both cells. B, mean current-voltage relationships obtained by measuring peak outward It (left) and the current magnitude at the end of 500 ms pulses (right). At a potential range of -110 to -40 mV this measurement reflects IK1, which was unaffected by insulin. For membrane potentials positive to -30 mV, this measurement reflects Iss, which was significantly increased by insulin. ○, values obtained in myocytes in the absence of insulin (n = 31); •, values in the presence of insulin (n = 23). Values are means ± s.e.m. (*P < 0.05; **P < 0.01).
