
Figure 4. The individual response pattern of a neurone of a spinal nerve-ligated rat at PO days 14–17.
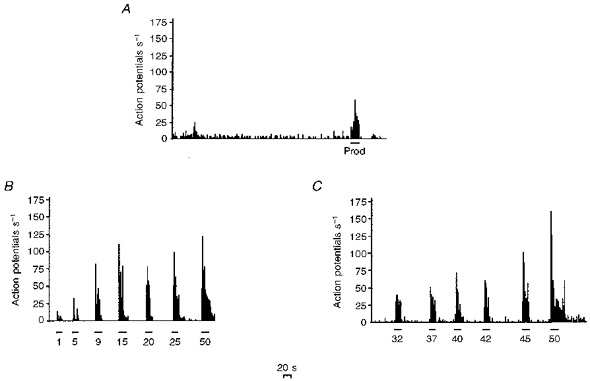
A, an example of the on-going spontaneous activity of a single neurone; the response of this neurone to prod stimulation is indicated and the period of stimulation is shown by the horizontal bar. B, the response of this neurone to graded mechanical punctate stimuli. The strengths of the stimuli, in grams, are indicated on the x-axis and the duration of stimulation is shown by the horizontal bars. C, the response of this neurone to graded thermal stimuli. The temperatures of the stimuli (°C) are indicated on the x-axis and the duration of stimulation is shown by the horizontal bars. In all cases the x-axis represents time in seconds (the scale is indicated), and the y-axis represents action potentials per second.