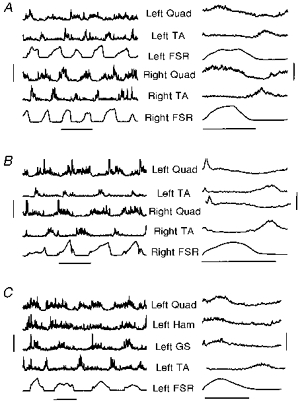
Figure 3. Electromyography and foot contact patterns during treadmill stepping.

The EMGs from left and right limbs during treadmill stepping are shown for subjects B. P. and A. J. in A and B, while those from 4 muscles in the left limb are shown for subject C. D. in C. The ages of these subjects at the time of recording were 2, 7.2 and 3.3 months, and the treadmill speed was 0.10, 0.19 and 0.12 m s−1, respectively, for A, B and C. The vertical bars on the left indicate the scale for each of the EMG graphs, which is 200 μV for A, 120 μV for trace 4, and 100 μV for all other traces in B, and 60 μV for trace 2, 50 μV for trace 4, and 100 μV for traces 1 and 3 in C. The data from force sensors (FSR) are in arbitrary units. The traces on the right represent the means of a number of undisturbed steps (19 and 20 steps for the left and right legs for A, 62 and 72 steps for the left and right legs for B, and 25 steps for C). The EMG scale is indicated by the vertical bar on the right, which is 60 μV for trace 1 and 80 μV for all other traces in A, 30 μV for trace 2 and 70 μV for all other traces in B, and 20 μV for trace 2 and 40 μV for all other traces in C. The horizontal bars at the bottom of each section represent 1 s for each of the graphs.
