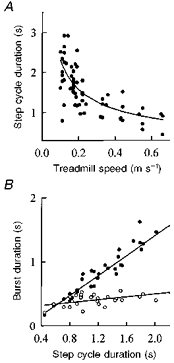
Figure 6. Step cycle and EMG burst durations at different speeds for all subjects.

A, pooled data from 38 subjects shows that the step cycle duration varies systematically with treadmill speed. Note that 9 out of the 38 subjects were tested at a number of speeds, and thus contributed more than one data point to this figure. The relationship is fitted with a power function y = a/xb, where a = 0.65, b = 0.55. B, EMG burst durations for the gastrocnemius-soleus (GS; •) and tibialis anterior (TA; ^) muscles for the 9 subjects tested at a number of speeds indicates that the change in step cycle duration results almost entirely from a change in the extensor burst duration. The correlation coefficient, r, was 0.94 for the extensors and 0.53 for the flexors.
