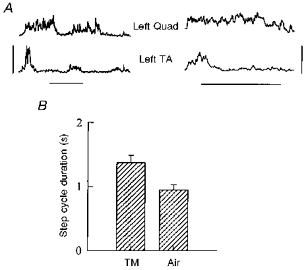
Figure 8. EMG and cycle durations for airstepping.

A, rectified and smoothed EMG data from subject A. J. during 2 airsteps is shown on the left. The mean over 4 steps in the same subject is shown on the right. The vertical bar represents 70 μV for the traces on the left and 40 μV for the traces on the right. The horizontal bars represent 0.5 s. B, the cycle duration pooled across 9 subjects shows that the airsteps were significantly shorter in duration than the treadmill steps.
