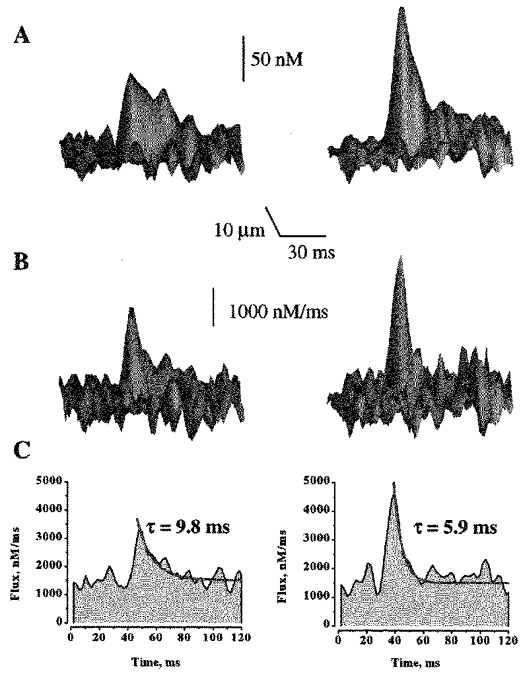
Figure 3. The effect of increasing SR Ca2+ load on Ca2+ sparks and the underlying Ca2+ release fluxes.

A and B, representative surface plots of Ca2+ sparks and associated Ca2+ release fluxes measured in the presence of 1 and 5 mm Ca2+ in the extracellular solution. The signals were obtained from single release events measured before and after raising [Ca2+]o from 1 to 5 mm in the same cell. C, line plots of Ca2+ release fluxes through the peaks of the signals shown in B. The release flux decays were best fitted by single exponentials functions (red lines). Background [Ca2+]i at 1 mm [Ca2+]i was assumed to be 100 nm; background [Ca2+]i at 5 mm [Ca2+]o was extrapolated to be 124 nm.
