
Figure 5. A superficial Ca2+ spark.
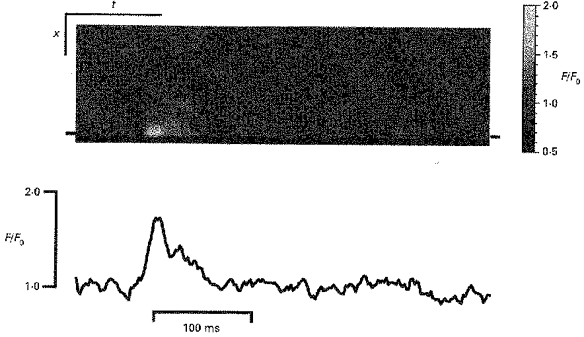
A normalized line-scan image obtained by scanning transversely across the cell every 2 ms is shown (top). A single spontaneous calcium release event occurs at a point where the scan line crosses the cell edge. The time course plot of the normalized fluorescence changes at the superficial site (indicated by bars in the line-scan image) is shown below the image. Scale bars: x, 3 μm; t, 100 ms.