
Figure 6. Effect of the ATP-activated Ca2+ influx on the internal Ca2+ mobilization.
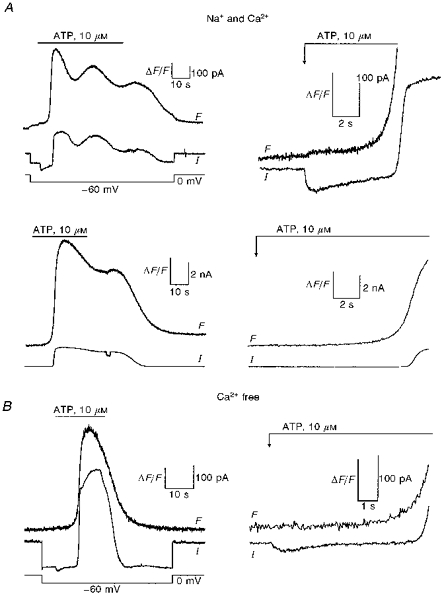
Cells were loaded with 100 μm fluo-3. Fluorescence data expressed as ΔF/F (vertical scale bar, ΔF/F = 1) after the addition of 10 μm ATP. A, full (left) and expanded (right) fluorescence (F) and Ca2+-dependent K+ conductance (I) traces at −60 mV (top) and 0 mV (bottom) in a single guinea-pig hepatocyte. B, lack of increase in fluo-3 fluorescence associated with the ATP-activated inward current at −60 mV in a Ca2+-free solution. Full (left) and expanded (right) traces.