
Figure 3. The effect of [K+]o on the action of Ca2+ on HERG currents.
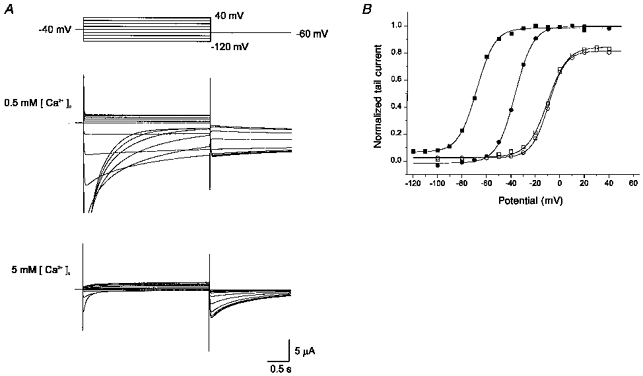
A, superimposed current traces elicited by depolarizing voltage pulses (3 s) in 10 mV steps (upper panel) from the holding potential of −40 mV in high-K+ solution (20 mm) with 0.5 mm (middle panel) and 5 mm (lower panel) [Ca2+]o. Some of the initial parts of the current in 0.5 mm [Ca2+]o are out of scale. Tail currents were recorded on repolarization to −60 mV. B, plot of the normalized tail current measured at its peak just after repolarization. The same experiment shown in A was performed in 2 mm [K+]o in the same cell and the data are shown in the plot. ▪, 0.5 mm [Ca2+]o-20 mm [K+]o; □, 5 mm [Ca2+]o-20 mm [K+]o; •, 0.5 mm [Ca2+]o-2 mm [K+]o; ○, 5 mm [Ca2+]o-20 mm [K+]o. Lines are the fits to the Boltzmann equation, y = 1/{1 + exp(-(V - V1/2)/dx)} (V1/2 from left to right, −68, −36, - 10, and −9 mV; dx from left to right, 7.3, 7.3, 8.1, and 6.8 mV). Same observation from three cells.