
Figure 1. Increase in quantal size produced by hCGRP.
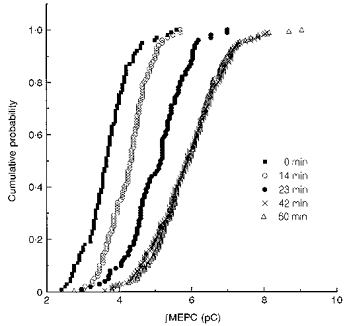
Cumulative plots showing the increase in the size of the ∫MEPC values at an endplate as a function of the time of exposure to 16 nm hCGRP. The times at which the recordings were begun are shown to the right of the plots.