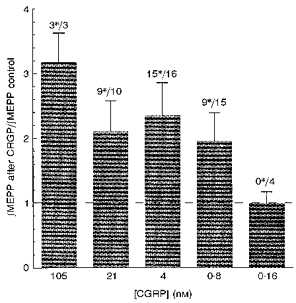
Figure 2. The effects of 1 h incubation in different concentrations of hCGRP on quantal sizes.

The bars show the ratio of the ∫MEPP values before and after the exposure. The error bars show the +95% confidence limits for the means of the ratios. In each experiment about 100 MEPP values were measured from 5 junctions in both the control and experimental groups. The figures above the bars show the number of experiments in which the experimental results were significantly different from the controls as measured by ANOVA (indicated by the *), followed by the total number of experiments.
