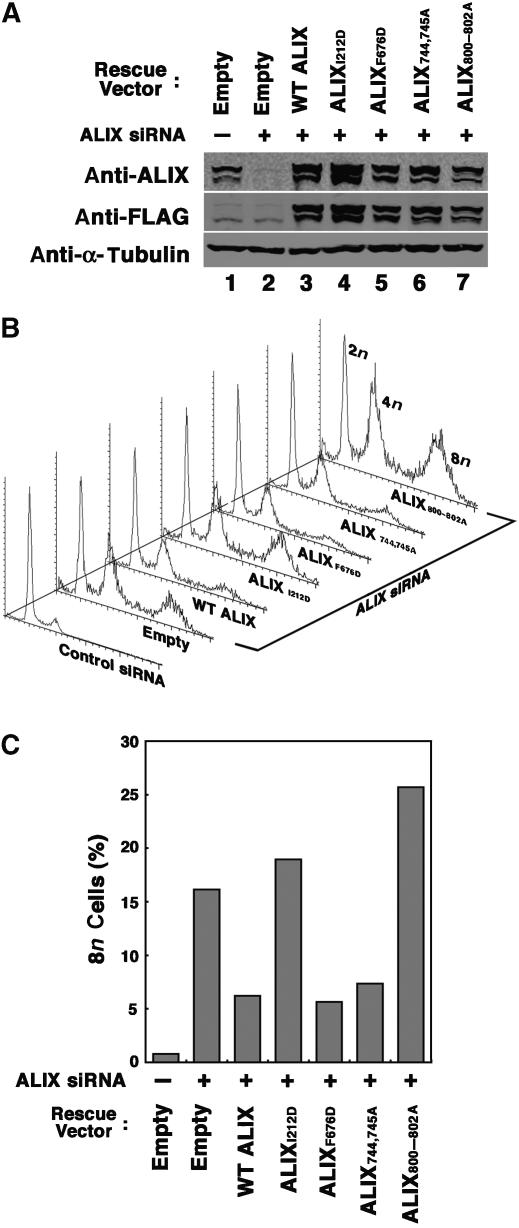
Figure 6.
Requirements for different ALIX interactions in cytokinesis. (A) Western blot showing ALIX depletion/re-expression. Upper panel: ALIX levels (anti-ALIX detection) in cells depleted of endogenous ALIX (lanes 2–7) or treated with a control siRNA (lane 1). Cells in lanes 3–7 were cotransfected with vectors expressing WT FLAG-ALIX (lane 3), or the designated FLAG-ALIX mutants. Middle panel: same samples probed with an anti-FLAG antibody. Lower panel: α-Tubulin loading controls. (B) Stacked FACS profiles showing the effects of ALIX depletion/re-expression on cell polyploidy. Samples are the same as in panel A. (C) Percentages of cells with 8n contents following ALIX depletion/re-expression. The plot shows the relative integrated 8n peak volumes in the FACS profiles from panel B. Note that although siRNA-resistant WT ALIX did not fully rescue the polyploid phenotype, the partial rescue phenotypes shown here were highly reproducible (n=11).

