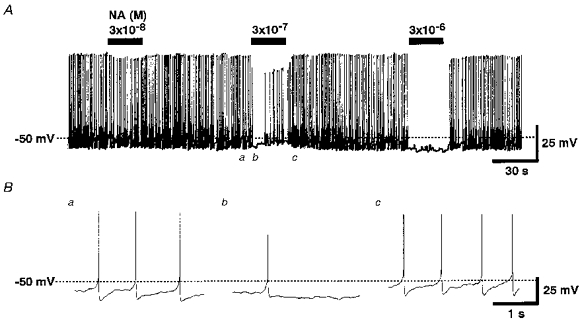
Figure 1. Effect of NA on the membrane potential of an LC neurone.

A, spontaneous action potentials recorded in the perforated patch recording configuration. NA (3 × 10⁻⁸, 3 × 10⁻⁷ and 3 × 10⁻⁶ m) was added to the external solution as indicated by the bars. The action potentials are not fully resolved because of the insufficiently high frequency response of the chart recorder. B, digitized potential traces at symbols a-c indicated in A.
