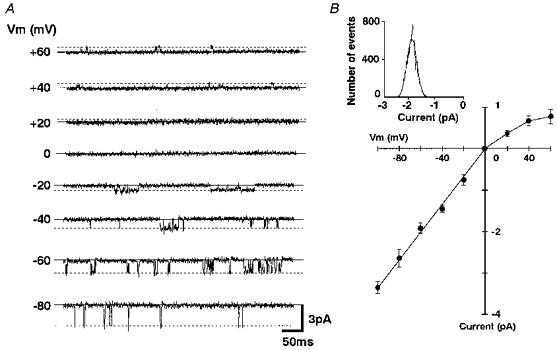
Figure 9. The I-V relationship of the NA-induced single channel current.

A, the NA-induced single channel current recordings obtained at various Vm values. The patch pipette contained 10−7 m NA. The continuous lines show the closed level and the dashed lines show the open level. B, I-V relationship of the NA-induced single channel currents. Each point and the vertical bars show the mean ±s.e.m. from 5 neurones. The inset shows an amplitude histogram of the currents recorded at −60 mV. The channel openings were fitted to the Gaussian curve with a peak value of −1.92 pA.
