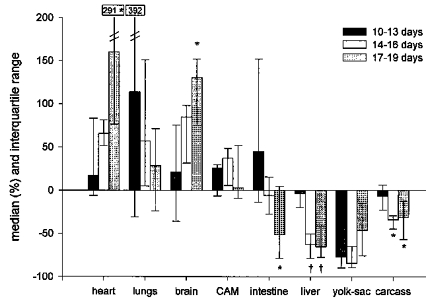
Figure 3. Magnitude of response to hypoxia for increasing incubation time.

The bars represent the median change expressed as percentage of baseline level with the interquartile range (p25-p75). *P < 0.05 compared with 10–13 days group; †P <0.01 compared with 10–13 days group.
