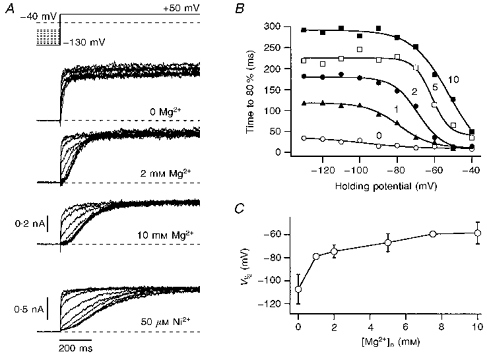
Figure 2. Mg2+ and Ni2+ dependence of h-eag channel activation.

A, the activation kinetics of h-eag channels depend upon the holding potential. Current traces are shown for depolarizations to +50 mV from holding potentials ranging from -130 to −40 mV in steps of 10 mV. While in the first trace the external solution contained only 2 mm Ca2+ as divalent cations in the 5 mm K+ solution, data in the next traces were recorded in external solutions with additional 2 and 10 mm Mg2+ and 50 μm Ni2+. The data for Ni2+ were obtained from a different cell. B, the rise time to 80 % of the maximal current was determined from idealized traces (see Methods) and is plotted here versus the holding potential for the indicated Mg2+ concentrations (mm). The continuous curves are fits according to a first-order Boltzmann equation (eqn (1)), yielding an apparent voltage where the transition between slow and fast activation phases occurs, V½. C, V½ values determined from experiments described in B are plotted as a function of the Mg2+ concentration. The error bars indicate s.d. values; the data points are connected by straight lines.
