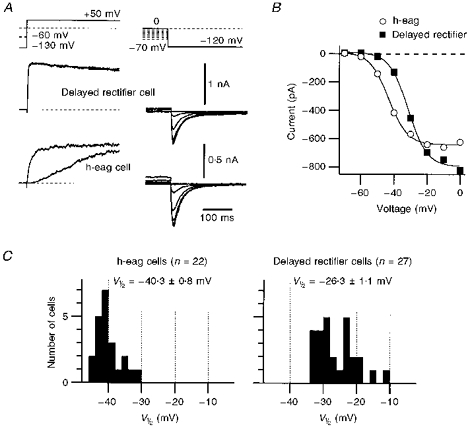
Figure 6. Expression of h-eag correlates with the activation threshold of HERG.

A, the expression of h-eag and delayed rectifier currents was assessed by double-pulse protocols to +50 mV from −60 and −130 mV (see also Fig. 4). In the same cells, bathed in 40 mm K+ solution, activation of HERG channels was determined by depolarizing the cells for 10 s to the indicated voltages and by measuring the resulting tail currents at −120 mV. HERG-mediated currents (right traces) and the corresponding outward currents (left traces) originate from identical cells. B, K+ inward current through HERG channels (see A) is plotted as a function of the prepulse potential. ^, currents from the cell which expressed h-eag.▪, currents from the cell which expressed delayed rectifier channels. The continuous curves are first-order Boltzmann fits to the data. C, the distribution of half-maximal activation voltages, V½, determined from plots as shown in B are presented as histograms. For this purpose, cells were divided into two groups: one which expressed h-eag only (left) and one in which only delayed rectifiers contributed to the outward currents (right). The mean values of the V½ distributions are indicated.
