
Figure 1. The calibration of intracellular indo-1.
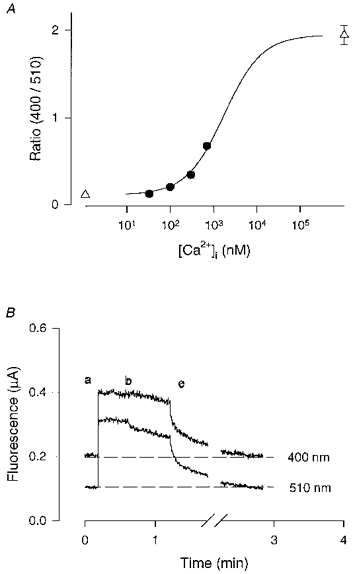
A, the whole-cell patch clamp technique was used to buffer the cell [Ca2+] to various levels set by Ca2+-EGTA buffers in the patch pipette. The pipette also contained 400 μm indo-1. •, means ± s.e.m of experimental data from at least 5 cells for each point (error bars in most cases smaller than symbols). ▵, ratios achieved with EGTA alone (Rmin) and Ca2++ CaEGTA (Rmax). The continuous line is the least squares fit of eqn (1) to the data points and gave a Kdβ= 1720 ± 130 nm. B, the decline of fluorescence at 400 and 510 nm (F400 and F510) after breaking the membrane of a cell loaded with indo-1 AM. The labels in the figure represented background (a); the F400 and F510 from an indo-1 AM loaded cell before (b) and after breaking the cell membrane (c). F510 signal was shifted down by 0.5 unit to help distinguish the two traces.