
Figure 1. General features of the tension response to a ramp stretch and its analysis.
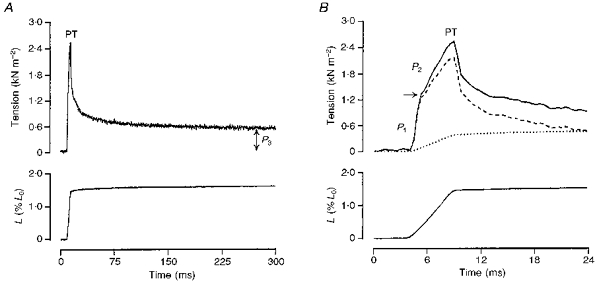
The tension response (upper trace) induced by a moderately fast ramp stretch (bottom trace; L, fibre length) are displayed at two time scales in A and B. In A, the tension rises rapidly during the stretch to reach a peak (PT) at the end of the ramp. Thereafter, it decays in a complex manner to reach a plateau (P3) tension at the stretched length when sarcomere length remains relatively constant. The rising phase of the tension response in B consists of an initial rapid tension rise to a break (arrow; P1) and a slower tension rise (P2). The dotted trace in B is sarcomere length record normalized to P3 tension and represents the net P3 tension response. Subtracting the P3 tension from the original tension response gives the difference trace (dashed line) which in this case consists of P1 and P2 tension components. All traces are from a fast-twitch muscle fibre bundle at 10 °C.