
Figure 9. Temperature dependence of the various tension components.
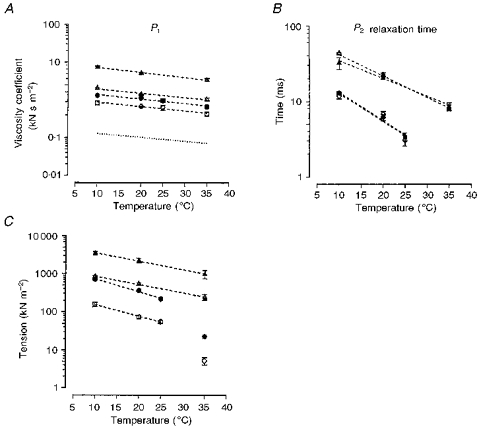
The viscosity coefficient obtained from analyses of P1 tension (A), the relaxation time of P2 tension analyses (B) and plateau P2 tension (C) (expressed as a Young's modulus) are plotted against temperature (note that the vertical axes are logarithmic); the lines are fitted regressions to the pooled data but the symbols denote the mean and the vertical bars the s.e.m. Circles are data from fast-twitch fibres; triangles, data from slow-twitch fibres; open symbols at sarcomere length of 2.7 μm; and filled symbols at 3.0 μm. The dotted line in A represents the change in the viscosity of pure water at atmospheric pressure multiplied by 105 (data are from Felix, 1972). Note that all the lines in A have approximately the same slope, suggesting similar temperature dependence, Q10 of ∼1.3: the relaxation time of the viscoelasticity (P2) has a higher Q10 of 2.4 in the fast-twitch muscle fibres and of 2.0 in the slow-twitch muscle fibres. P2 tension has an intermediate Q10 of 1.5–1.7 in the two fibre types. In fast-twitch muscle fibres, the plateau P2 tension at 35 °C could not be accurately estimated by curve fitting (see text): the symbols denote values obtained from the average measurements at three stretch speeds within the plateau region and these were not used in the calculation of the Q10 given above.