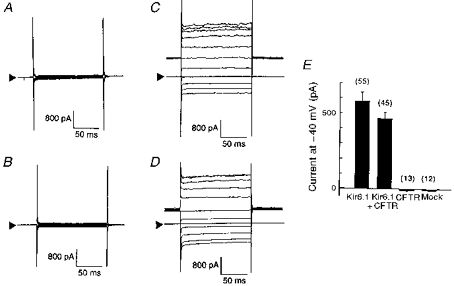
Figure 1. Whole-cell currents from cells transfected with Kir6.1 and/or CFTR.

Four sets of whole-cell current traces recorded from mock- (A), CFTR- (B), Kir6.1- (C), and Kir6.1-CFTR-transfected (D) cells in response to voltage steps from −140 to +60 mV from a holding potential of −40 mV (20 mV steps). Extracellular K+ concentration was 5.4 mm in all experiments. Arrowheads indicate the zero current level. E, bar-graphs showing current amplitude measured at −40 mV holding potential from each group of cells. Error bars indicate the standard deviation, and the numbers in parentheses the number of observations.
