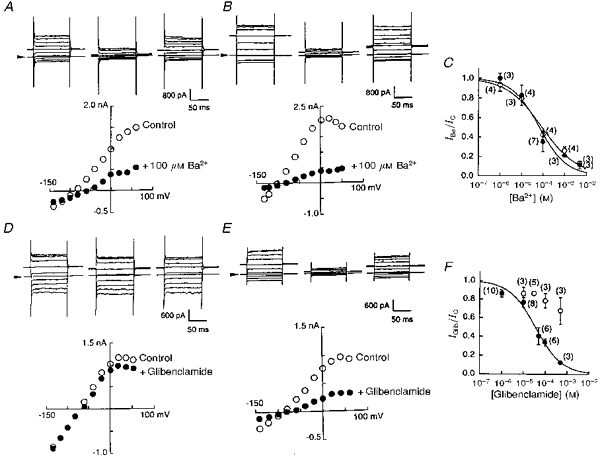
Figure 4. Co-transfection with CFTR conferred sensitivity to glibenclamide on Kir6.1 channels.

A and B, whole-cell curent traces recorded before, during and after application of Ba2+ (100 μm) to a Kir6.1-transfected cell (A) or to a cell co-transfected with Kir6.1 and CFTR (B). Arrowheads indicate the zero current level. Graphs below the traces show I-V relationships measured from original current traces in control (^) and in the presence of Ba2+ (•). C, Ba2+ concentration-inhibition relationships in Kir6.1-transfected (^) and co-transfected (•) cells. Smooth lines were drawn by fitting to the Hill equation with h= 0.53 ± 0.07 (^) and h= 0.68 ± 0.15 (•). Numbers in parentheses indicate the number of observations. D and E, whole-cell curent traces recorded before, during and after application of glibenclamide (30 μm) to a Kir6.1-transfected cell (D) or to a cell co-transfected with Kir6.1 and CFTR (E). Graphs indicate I-V relationships measured from the original current traces indicated above in control (^) and in the presence of glibenclamide (•). F, glibenclamide concentration-inhibition relationships for Kir6.1-transfected (^) and co-transfected (•) cells. Mean values and standard deviations are shown. Numbers in parentheses indicate the number of observations.
