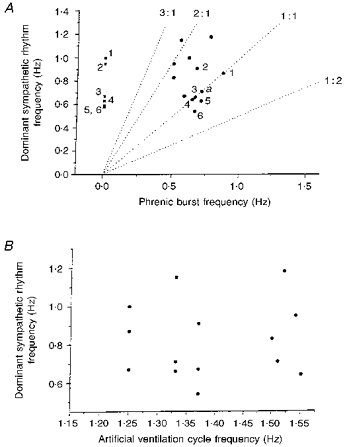
Figure 5. Scatter diagrams relating the frequency of the dominant sympathetic rhythm to the respiratory frequencies.

A, scatter diagram relating the frequency of the dominant sympathetic rhythm and that of the phrenic rhythm in 14 cases during normocapnia and normothermia, and 6 cases in hypocapnic apnoea (nos 1-6 indicate points taken from the same unit in both hypocapnia and normocapnia). ▪, during hypocapnic apnoea. •, during normocapnia (a denotes 2 cases superimposed). Dotted lines represent frequencies at which sympathetic and phrenic rhythms have a 3:1, 2:1, 1:1 and 1:2 relationship. Note that integer and non-integer ratios occur. B, scatter diagram relating the frequency of the dominant sympathetic rhythm to that of the artificial ventilation cycle during normocapnia and normothermia (n = 14). It can be seen that the artificial ventilation was never related 1:1 to the dominant sympathetic rhythm. Therefore the sympathetic bursts were not a direct result of the stimulation of afferents during the lung inflation cycle.
