
Figure 4. Effect of ATP concentration on the activity of human and murine CFTR Cl− channels.
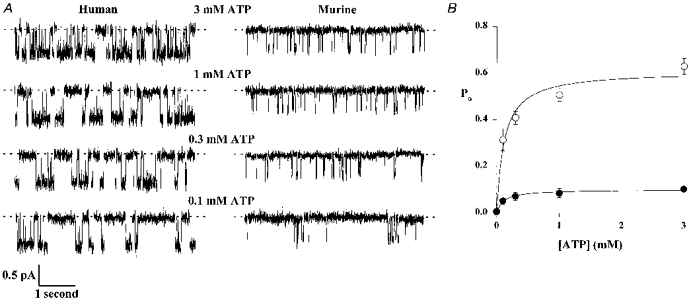
A, comparison of the effect of different ATP concentrations on the activity of human and murine CFTR Cl− channels. PKA (75 nM) was present throughout; voltage was −50 mV. Each trace is 5 s long. B, relationship between ATP concentration and Po for human (○) and murine (•) CFTR. Symbols and error bars indicate means ±s.e.m. of n = 4-5 values at each concentration. Continuous lines are Michaelis-Menten fits to the mean data.