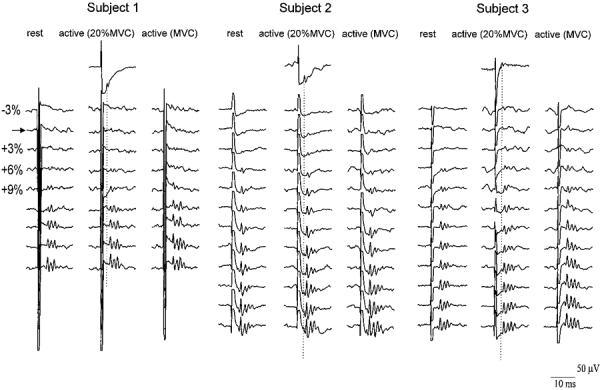
Figure 1. Descending volleys evoked by magnetic stimulation using increasingly strong stimulus intensities and with different degrees of voluntary contraction in three subjects.

The traces show averaged (10 sweeps each) epidural recordings from the high cervical cord. The vertical columns of traces are arranged in order of increasing magnetic stimulus intensity, from 3% of stimulator output below the threshold for evoking EMG responses in active muscle (horizontal row marked by arrow) to 21% (subject 1) or 30% (subjects 2 and 3) above threshold in steps of 3%. Each subject contributes 3 columns of results, recorded at rest (left), 20% maximum contraction (middle) and 100% maximum contraction (right) of FDI muscle. The single trace for each subject in the top row shows the potentials recorded after transcranial electrical stimulation of the motor cortex. The stimulus intensity in this trace was 5% of stimulator output above the threshold for evoking EMG responses in active muscle, and the responses were recorded during a voluntary contraction of 20% maximum. The peak latency of the first volley evoked by electrical stimulation (D-wave) is indicated by the vertical dotted line. In all three subjects and in all recording conditions the size and number of waves increased as the stimulus intensity was increased. The waves recruited by low intensity magnetic stimulation are probably I-waves. At high intensities, a D-wave can be seen in subjects 2 and 3. Voluntary contraction, particularly at maximum strength, slightly reduces the threshold intensity at which magnetic stimulation evokes I-waves, and increases their amplitude and number at higher intensities.
