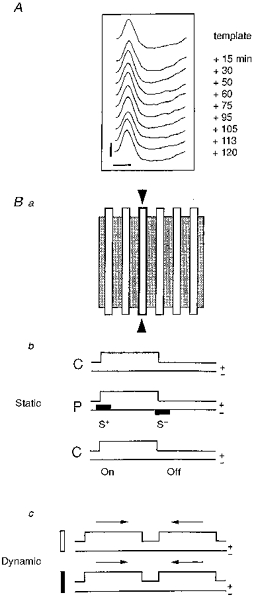
Figure 1. Experimental protocol.

A, for each cell, the shape of the extracellular action potential (AP) was monitored on a digital oscilloscope and continuously compared with an initial template in order to make sure that the same neuron was recorded throughout the experiment (calibration bars: 1 mV; 1 ms). Ba, the spatial distribution of ‘on’ and ‘off’ responses in the RF (shaded area) was explored (‘static’ mode) with an optimally oriented stationary bar flashed sequentially in several positions (open bars). b, during control conditions (C) the optimal stimulus was presented 10-50 times without iontophoretic current (upper line: ‘on-off’ state of the stimulus with ‘on’ duration, 3000 ms and ‘off’ duration, 3000 ms; lower line: no iontophoretic current). During pairing (P), the visual stimulation was restricted to a given position in the RF (outlined contour indicated by 2 arrowheads in a). Iontophoretic pulses of opposite polarity (filled rectangles on the lower line; upward for positive, downward for negative current) were applied through the KCl recording electrode concomitantly with the presentation (‘on’) and the extinction (‘off’) of the visual stimulus. Intensity and polarity (+/−) of the current was adjusted in such a way as to impose a significant increase (S+) or decrease (S−) of the visual response. Following pairing the RF was explored in the paired and unpaired positions under the same conditions as the initial control (C, without current). c, in a few cells, responses to moving stimuli (dynamic mode) were also determined using optimally oriented light (open) and dark (filled) bars moving back and forth (arrows) through the RF.
