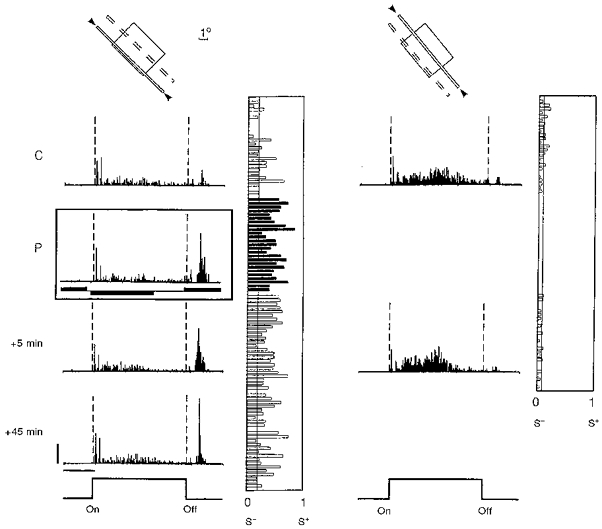
Figure 3. Potentiation of the ‘off’ response of a simple cell recorded in a 5-week-old kitten.

Response histograms for the paired and control (unpaired) positions are shown in the left and right panels, respectively. Before pairing, this cell exhibited a strong dominant ‘on’ response in both positions and was classified as simple. The pairing procedure consisted of 50 associations of a negative current pulse (-4 nA, 2000 ms duration) with the presentation of the stimulus, and of a positive current (+4 nA, 2000 ms) with the extinction of the same stimulus. The onset of the current pulses preceded the ‘on’ and ‘off’ transitions of the visual stimulus by 100 ms. During pairing (P, inset) a significant modification of the ‘on/(on + off)’ ratio was imposed. After pairing (+5 min), the ‘off’ response in the paired position was significantly potentiated (P < 0.0001). This effect was selective for the paired position (P < 0.005vs. P > 0.10 for the unpaired position) and lasted for 45 min until the cell was lost. Calibration bars: 1 s; 10 AP s−1. In this figure and the following ones, each RF is schematized by a rectangle at the top of the panels whose relative size and orientation corresponds to that charted on a drawing table (open zone, ‘on’ field; filled zone, ‘off’ field; chequerboard pattern, complex RF). The positions within the RF used for automated recordings are represented by thin, oriented open bars. The continuous outline and the arrowheads indicate the test stimulus which was flashed ‘on’ and ‘off’ to build the PSTHs placed in the same column; the other test positions, which were presented alternately, are indicated by a dotted outline. PSTHs are shown from top to bottom sequentially during an initial control period (C), during pairing (P, inset, with filled rectangles to indicate the polarity and timing of the iontophoretic pulses), and at various times following pairing (in minutes). The temporal evolution of the local complexity ratio (LCR), given by S+/(S++ S−) and calculated by a moving average technique over 2-4 epochs of visual stimulation (see Methods), is represented to the right of each corresponding histogram. The narrow vertical line indicates the mean value of the complexity ratio in the control period.
