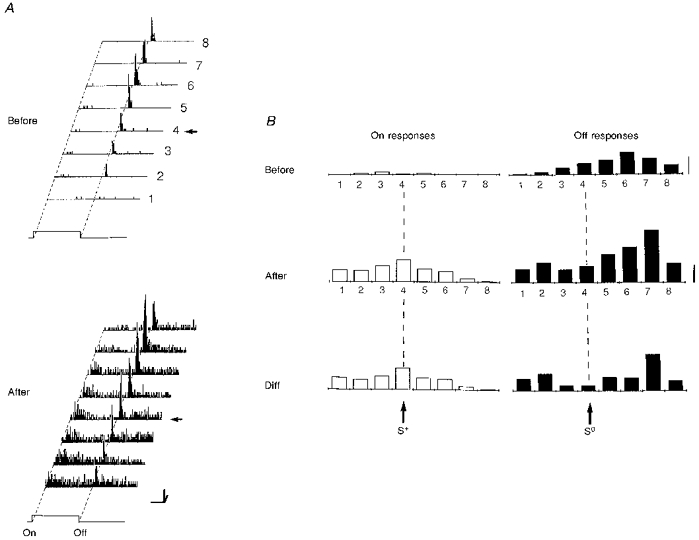
Figure 6. Modification of a pure ‘off’ simple cell into a complex cell recorded in a 6-week-old kitten.

A, the RF of this neuron was characterized before and after conditioning in 8 positions. The pairing procedure (64 associations; not shown) was performed on the fourth position (arrow) by applying a positive current pulse (S+, +8 nA) through the recording pipette while the stimulus was turned ‘on’. No current was passed at the extinction of the stimulus (S0). Fifteen minutes after pairing, an ‘on’ response was unmasked in the RF (LCR, P < 0.0001), and the global complexity ratio (GCR) increased significantly from 0.06 to 0.33 (P < 0.0003). Calibration bars: horizontal, 1 s; vertical, 20 AP s−1; oblique, 1 deg. B, the spatial distribution of ‘on’ and ‘off’ responses given by the histograms on the right were computed after subtracting the corresponding levels of spontaneous activity. Calibration bar: 5 AP trial−1. General conventions for Figs 6–7 are as follows. Left panel (A): RF response planes. PSTHs are represented for 8 contiguous positions, numbered 1 to 8. The position used during pairing is indicated by a horizontal arrow. Right panel (B): from top to bottom, spatial distribution of ‘on’ responses (open bars, left column) and ‘off’ responses (filled bars, right column), before (upper row) and after (middle row) pairing. The lower histograms (Diff) represent the spatial distribution of absolute gain and losses in visual responses across the RF, given by the difference between the positional tuning curves measured after and before pairing.
