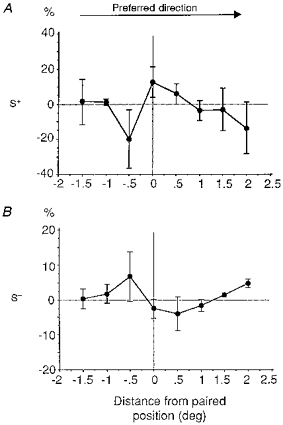
Figure 9. Spatial gradient of generalization of the functional changes and directional preference of visual cortical cells.

Distribution of the mean relative change in responses (%, ±s.e.m.) induced by pairing as a function of the distance across the RF width from the paired position (in degrees). The RF response profiles were aligned as a function of the preferred direction of each cell and linearly interpolated in order to be able to compare the behaviour of different cells at similar eccentricities from the paired position. The normalized changes in responses were established separately for the S+ (A) and the S− characteristic (B) and averaged across cells. The two graphs appear to be organized in mirror fashion and show an asymmetric spread of the long-term adaptation effect across the RF width which is correlated with the directional preference of the cell.
