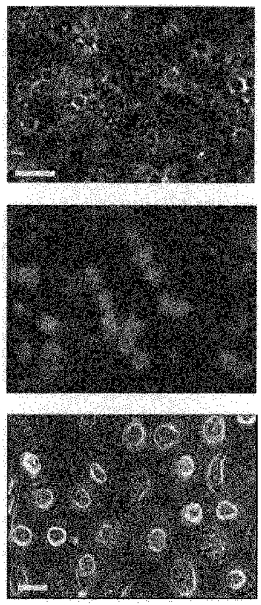
Figure 1. Photomicrographs of human hand vein endothelial (HHVE) cells.

A shows a phase contrast image of cells 2 h after isolation. B is the same field of view as in A but using fluorescence (FITC). Cells were stained with an endothelial cell-specific marker anti PECAM-1. Positive cells can be seen to cluster together or can be detected as single spherical cells. C is a phase contrast image of cells maintained for 11 days in tissue culture. At this time the cells have attained a flat ‘cobblestone’ appearance. Scale bars in A and C represent 20 μm.
