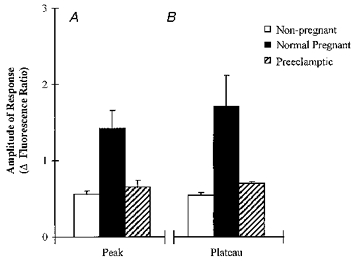
Figure 3. The responsiveness of HHVE cells to ATP.

Histograms of the amplitude of the Ca2+ transients of peak (A) and plateau (B) responses to ATP (1 μm). □, data from ‘non-pregnant’ cells; ▪, data from ‘pregnant’ cells;  , data from ‘pre-eclamptic’ cells. Details of numbers of cells in each group are given in the text.
