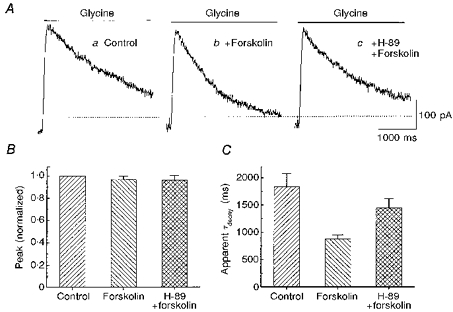
Figure 4. A protein kinase A inhibitor reversed the action of forskolin.

A, responses from one neurone show the outward current produced by 100 μM glycine alone (a), glycine plus 50 μM forskolin (b), and glycine plus forskolin during application of 1 μM H-89, a protein kinase A inhibitor (c). B, the graph compares the peak amplitude of the glycine current under these 3 conditions in 4 cells (mean and standard error). For each cell, the currents were normalized to the peak glycine current in control. C, in the same group of cells and for the same 3 conditions, the decays of the glycine current were compared. For each cell the decay of the current was fitted to a single exponential function. Cells were voltage clamped at 0 mV.
