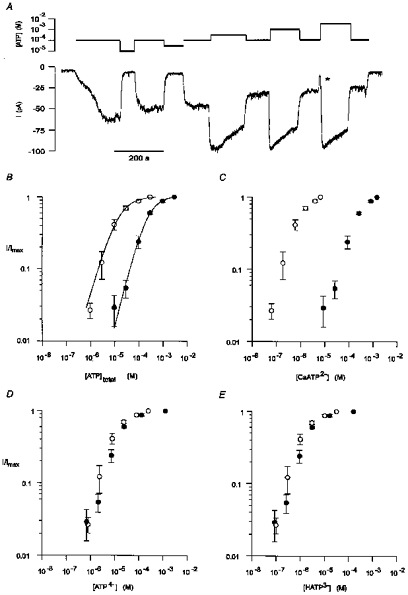
Figure 7. A form of ATP unbound by divalent cations was the active agonist.

A, continuous whole-cell current trace recorded at a holding potential of −40 mV during exposure to different concentrations of extracellular ATP. The concentrations of total added ATP are indicated above the current trace on a logarithmic scale. Each tested concentration of ATP was bracketed by a measurement with 100 μM ATP. During the transition from 100 μM ATP to 3 mM ATP the cell was briefly exposed to a solution containing no ATP (*). Standard intracellular and extracellular solutions. Digitized at 500 Hz, filtered at 100 Hz. Cell capacitance, 14.5 pF; series resistance, 6.5 MΩ. B, reducing the total concentration of CaCl2 in the extracellular solution increased the apparent effectiveness of total added extracellular ATP. Dose-response curves were constructed from current measurements similar to that shown in A using extracellular solutions containing either 1.58 mM CaCl2 (•) or 0.01 mM CaCl2 (○). For the extracellular solution containing 1.58 mM CaCl2, each tested concentration of extracellular ATP was bracketed by a measurement with 100 μM ATP. The currents were corrected for run-down by normalizing the response to a given concentration of ATP to the preceding response to 100 μM ATP. Each point represents the mean (±s.e.m.) of 10 experiments. For the extracellular solution containing 0.01 mM CaCl2, each point represents the mean (±s.e.m.) of 7 experiments, in which each tested concentration of extracellular ATP was bracketed by a measurement with 30 μM ATP, used to correct for run-down. The continuous lines are the least-squares fit to eqn (10) in Results. The concentrations of ATP for half-maximal activation (EC50) in the high and low extracellular CaCl2 were 210 and 14 μM, respectively. In both solutions the Hill coefficient (n) was 1.2. C-E, dose-response curves for the estimated concentrations of CaATP2-(C), ATP4-(D), and HATP3-(E) in the experiments shown in B.
