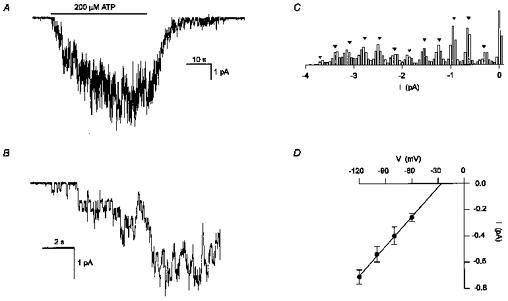
Figure 8. Ion channels were activated by extracellular ATP in outside-out membrane patches.

A, continuous current trace recorded at a holding potential of -80 mV from an outside-out membrane patch. The addition of ATP (200 μM) (indicated by the bar) activated several channels. Standard intracellular and extracellular solutions. The pipette solution contained GDP-β-S (200 μM) instead of GTP. Digitized at 500 Hz, filtered at 50 Hz. The onset of channel activation by ATP is shown at increased time resolution in B. C, all-point histogram of the current trace in B. Bin size of 0.05 pA. The interval between the inverse triangles is 0.31 pA. D, current-voltage relationship for the single-channel currents activated by extracellular ATP. Each point is the mean (±s.e.m.) unitary current averaged from 4 experiments. The continuous line is a linear regression which intercepted the voltage axes at -26 mV. Same solutions as in A.
