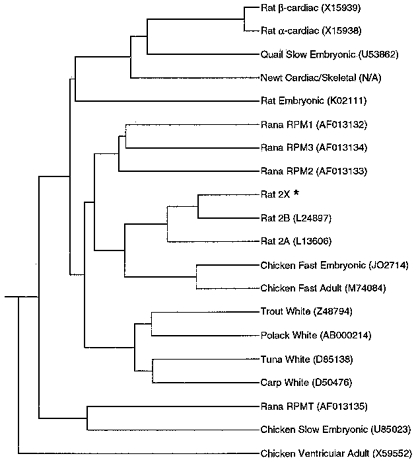
Figure 6. Evolutionary relatedness of MHCs.

Evolutionary tree comparing the homology between the four novel MHCs from R. pipiens skeletal muscle with MHCs of other species (see Discussion for details). Alignment was performed using clustal analysis (Geneworks, Oxford Molecular Group). GenBank/NCBI accession numbers are indicated in parenthesis. *Sequence from S. D. Shoemaker, A. F. Ryan & R. L. Lieber (unpublished observations).
