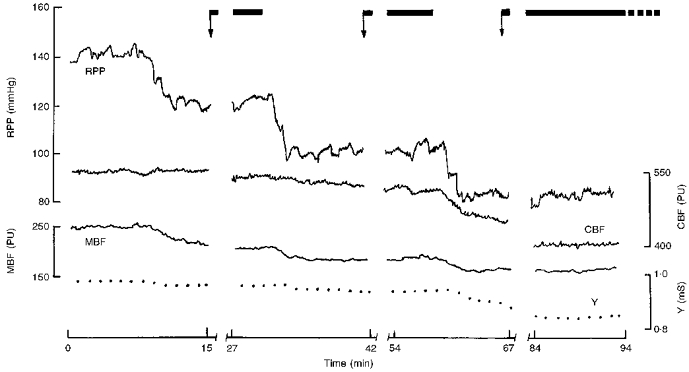
Figure 1. The changes in cortical and medullary blood flow (CBF and MBF, respectively) and medullary tissue admittance (Y) during step-wise reduction of renal perfusion pressure (RPP).

The arrows indicate the start of urine collection; note the time allowed for stabilization after RPP reduction. PU, laser Doppler perfusion units; mS, millisiemens.
