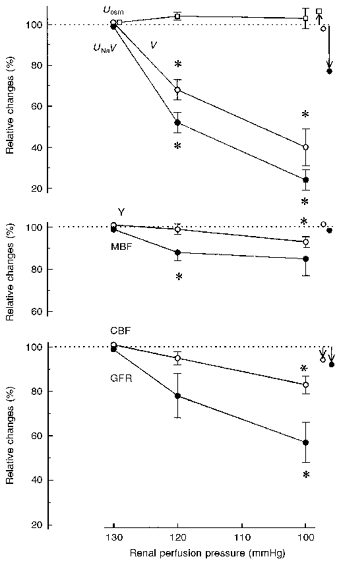
Figure 3. Renal excretion, haemodynamics and medullary tissue admittance in a group of rats with an initial RPP of 130 mmHg.

Values are given as means ±s.e.m. and represent per cent of the 130 mmHg value. Symbols with arrows to the right of the graphs show variations observed over 2 h at a constant pressure of 105 mmHg (control group). * Significantly different from the value for the closest higher pressure level at P < 0.001. For Uosm, V, UNaV and Y, n = 6; for MBF, CBF and GFR, n = 5. Abbreviations are as in Fig. 2.
