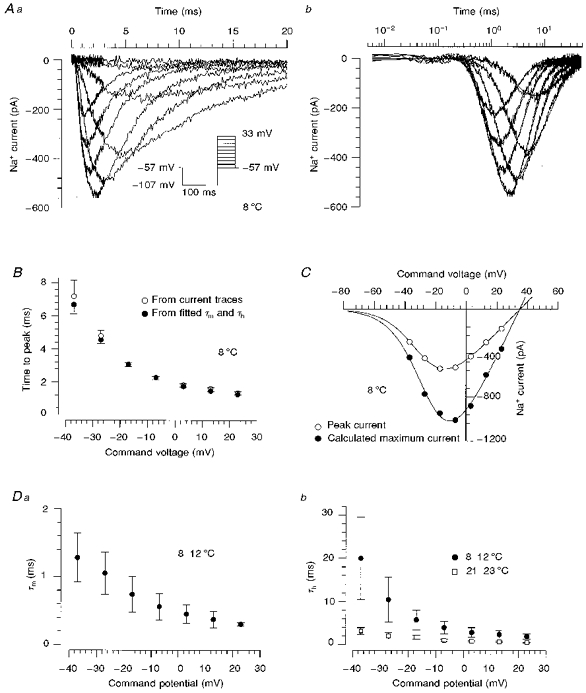
Figure 2. Properties of time-dependent activation and inactivation at 8 °C.

Aa, time course of Na+ currents elicited with an activation protocol in a human DGC at 8 °C with 83 mm NaCl in the extracellular solution. The traces were filtered at 10 kHz. The initial 3 ms following the onset of the voltage jump were sampled with a small sample interval of 6 μs, and the remaining parts of the traces with a sample interval of 50 μs. Ab, current traces obtained at 7 potentials (-38 to 22 mV) were fitted according to the Hodgkin-Huxley model (eqn (3)) including a time delay, ts, (smooth lines). The data are plotted on a logarithmic time scale in order to show the activation phase clearly. B, comparison of time-to-peak τmln(1 + 3τh/τm) (•), predicted by the Hodgkin-Huxley equation, and the time to peak observed from current traces (○). These data were obtained from 4 measurements of one human DGC. C, current-voltage relationships derived from the Hodgkin-Huxley fitted maximum Na+ current gNa(V - VNa) (•) and from peak Na+ current amplitudes (○). The smooth curves represent fits (eqn (1)) with km of 7.2 and 7.7 mV, V50m of −23 and −28 mV, of 23 and 12 pA mV−1, and VNa of 35 and 34 mV for the fitted maximum current and peak current, respectively. D, the voltage dependence of activation (Da) and inactivation (Db) time constants (n= 4). Recordings were performed at 8–12 °C (•) or at room temperature (□).
