
Figure 4. Voltage dependence of activation and inactivation.
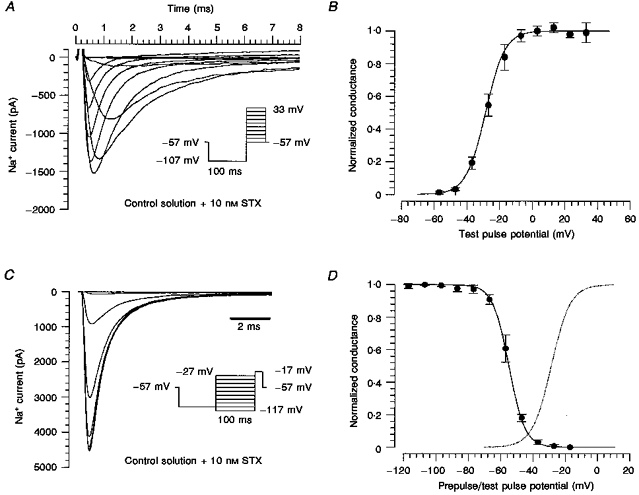
A, currents of a human DGC elicited by the activation protocol shown in the inset. The extracellular Na+ concentration was 163 mm. The current amplitude was reduced with 10 nm STX. B, mean values of the normalized conductance of 4 DGCs. The smooth curve through the data points was calculated from the mean values of the parameters obtained by fitting a modified Boltzmann function to the data points, with km= 5.9 ± 0.4 mV and (for comparison, see Fig. 1B). C, steady-state voltage-dependent inactivation of Na+ currents in a human DGC measured with test pulses to -17 mV following 100 ms conditioning prepulses that were incremented by 10 mV steps from -117 to -27 mV. The prepulses were preceded by a 100 ms pulse at -107 mV to remove slow inactivation. D, conductances were obtained from the peak currents, normalized and fitted with the Boltzmann equation (eqn (2), with and km replaced by and kh, respectively). The voltage of half-maximal inactivation, , was -55 ± 2 mV, and kh was -5.6 ± 1.1 mV (n= 3). The dotted line shows the fitted activation curve from B.