
Figure 4. Physiological correlation between IHT and the Kv3.1 current.
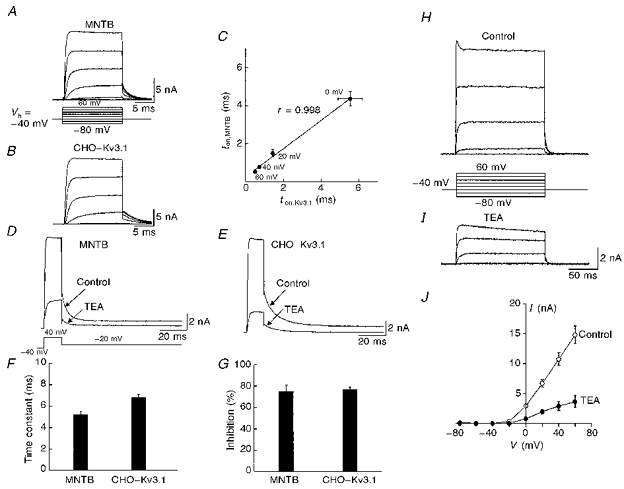
A and B, representative current traces recorded from an MNTB neurone and a CHO-Kv3.1 cell in response to a series of voltage steps from -80 to +60 mV in 20 mV increments. C, the 10-90 % rise time for maximal activation for MNTB neurones (ton,MNTB, n= 9) is plotted against that for CHO-Kv3.1 cells (ton,Kv3.1, n= 6) at different test voltages. D and E, similar kinetics of the tail currents recorded from an MNTB neurone and a CHO-Kv3.1 cell, and similar block by 1 mm TEA. These tail currents were well fitted by a single exponential function. F and G, a summary of the time constants calculated from the fitting of tail currents and the extent of block by TEA. H and I, current traces recorded from a CHO-Kv3.1 cell before and after addition of TEA (1 mm). J, the averaged current-voltage curves from seven CHO-Kv3.1 cells. The holding potential for these recordings was -40 mV.