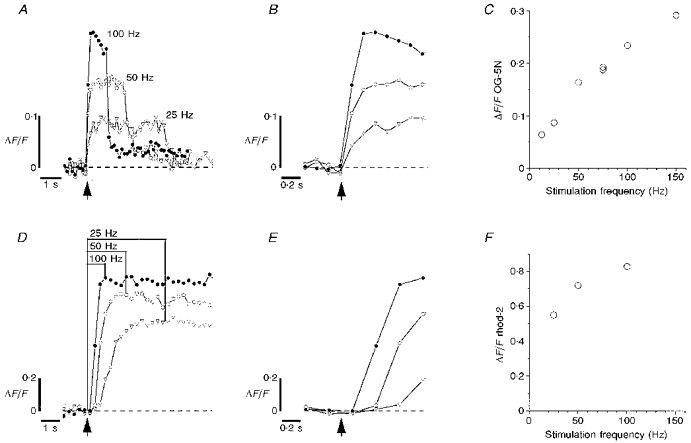
Figure 1. ΔF/F transients produced by stimulus trains of different frequencies in lizard external intercostal motor terminals filled with OG-5N (A-C) or rhod-2 (D-F).

A and D, time courses of changes in ΔF/F in response to 100 stimuli at 25, 50 and 100 Hz. B and E,ΔF/F transients at the onset of stimulation plotted on a faster time scale. C and F, peak ΔF/F (averaged from the last 3 points collected during the train) as a function of stimulation frequency. In C, the order of administering the trains was (Hz): 50, 100, 25, 75 (two trains), 12.5, 150. For the 150 Hz point 200 rather than 100 stimuli were administered. OG-5N and rhod-2 images were collected at 7.50 and 3.75 s−1, respectively. Each plot in D was the mean of two identical stimulus trains (order of delivery: 50, 100, 25, 100, 25 and 50 Hz). The estimated change in cytosolic [Ca2+] (Δ[Ca2+]c) at the transition between fast and slow rates of rise of OG-5N fluorescence during 50 Hz stimulation was 200 nm, calculated as described in David et al. (1997) assuming Kd= 60 μm, resting [Ca2+]= 100 nm, and Fmax/Fmin= 50. The illustrated findings are representative of those obtained in 8 terminals filled with OG-5N and 5 terminals filled with rhod-2.
