
Figure 3. Effects of CCCP on cytosolic and mitochondrial ΔF/F transients.
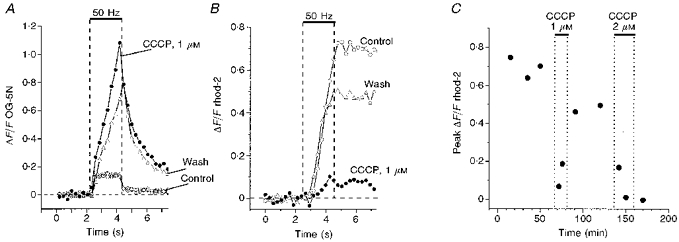
A and B,ΔF/F transients from terminals filled with OG-5N (A) or rhod-2 (B) in response to trains of 100 stimuli at 50 Hz (indicated by upper horizontal bar). ○, ΔF/F transients obtained under control conditions. A shows 3 superimposed trains separated by 15 min intervals, with a transition from fast to slow rates of rise at Δ[Ca2+]c of 150 nm. •, obtained 10 min (A) and 3 min (B) after adding 1 μm CCCP to the bath; Δ, obtained 30 min (A) and 48 min (B) after beginning CCCP washout. C, peak post-stimulation rhod-2 ΔF/F values in the terminal of B under control conditions, and following exposure to 1 μm CCCP, return to control medium, exposure to 2 μm CCCP, and return to control medium. Oligomycin (10 μg ml−1) was present during all but the first train. The trains plotted in B yielded the third, fourth and seventh points in C.