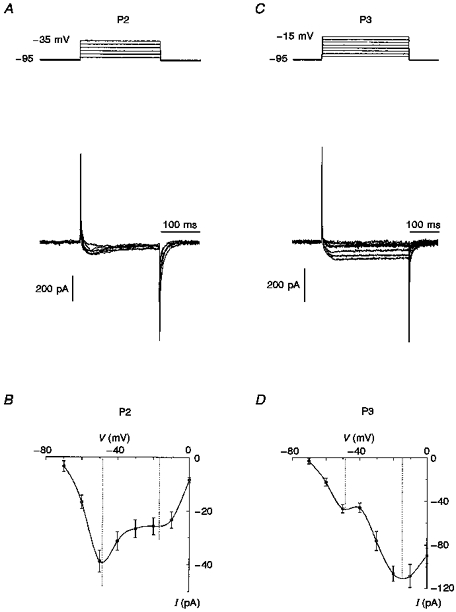
Figure 2. Changes in whole-cell Ca2+ current during the earliest stages of postnatal development.

A and C, depolarizing voltage steps from a holding potential of -95 mV for P2 (A) and P3 (C) neurones from layers V-VI evoked the superposition of transient LVA Ca2+ current and slowly inactivating HVA Ca2+ currents, the latter of which was predominant in P3 (C) neurones. The voltage protocol for each panel is shown at the top. B and D, I-V relationships of peak currents for neurones of the two age groups are presented beneath the current traces. The I-V relationships for neurones of both P2 and P3 age groups have 2 peaks, at about -50 and -15 mV, corresponding to LVA and HVA Ca2+ currents, respectively. For construction of the I-V curves data were averaged using 5 cells for P2 and 8 cells for P3 neurones.
